Physician finance
This Chart Should Change How You Think About Investing
Haseeb Aslam, MD6 min read
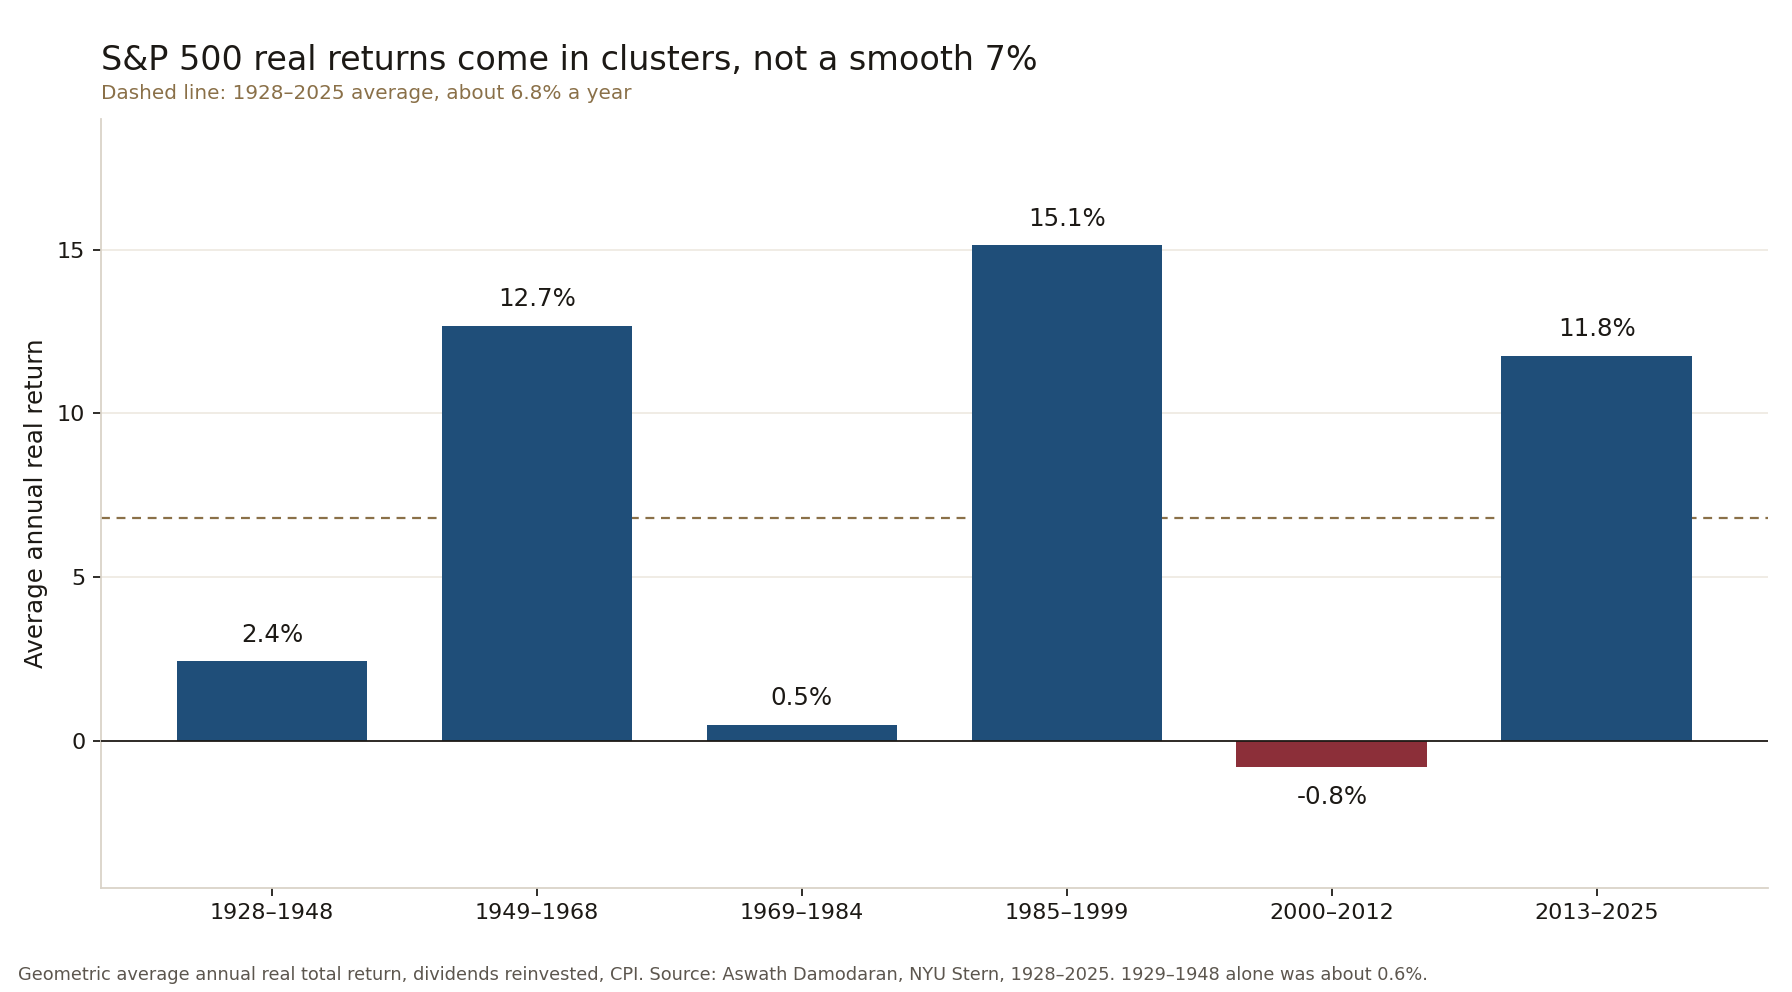
You have seen the long-term averages. Stocks return about 10 percent a year before inflation and roughly 7 percent after. That number is true over a century. It is also useless for planning the next fifteen or twenty years of your life. The chart below shows why.
From 1928 to 1948 the real return was about 2.4 percent a year. That window includes 1928, a very strong year. Leave it out and 1929 to 1948 was about 0.6 percent. From 1969 to 1984 the real return was about 0.5 percent. From 2000 to 2012 it was negative, about 0.8 percent a year. Those are not short blips. They are stretches longer than most physicians' peak earning years.
Then come the boom periods: about 12.7 percent, 15.1 percent, and 11.8 percent. The market does not deliver a smooth 7 percent. It delivers clusters of almost nothing and clusters of very high returns.
Real return matters because inflation is the silent tax. A nominal 7 percent return with 3 percent inflation leaves you with about 4 percent of buying power. In the flat periods the chart shows, even that was hard to get.
Why this hits physicians differently
Most of us start serious saving after residency or fellowship. That is often age 32 to 36. Student loans, a house, kids, and the first real paycheck arrive together. The compounding clock has already run for a decade while other people were adding money in their twenties. A twenty-year stretch of near-zero real returns that begins when you are 35 leaves you at 55 still waiting for the market to do the heavy lifting.
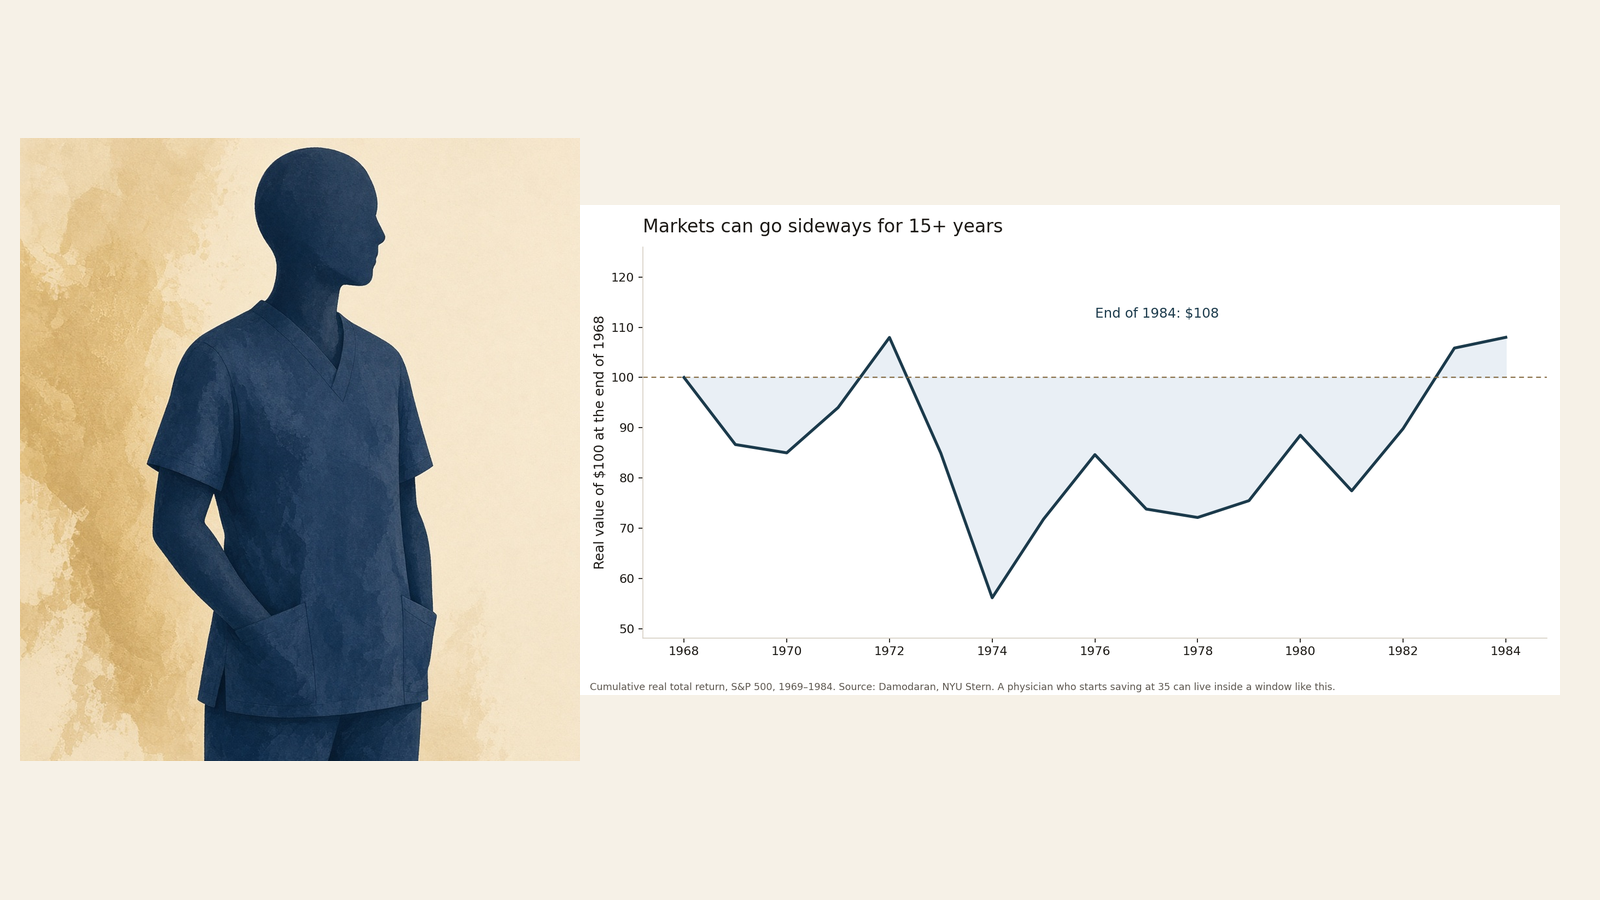
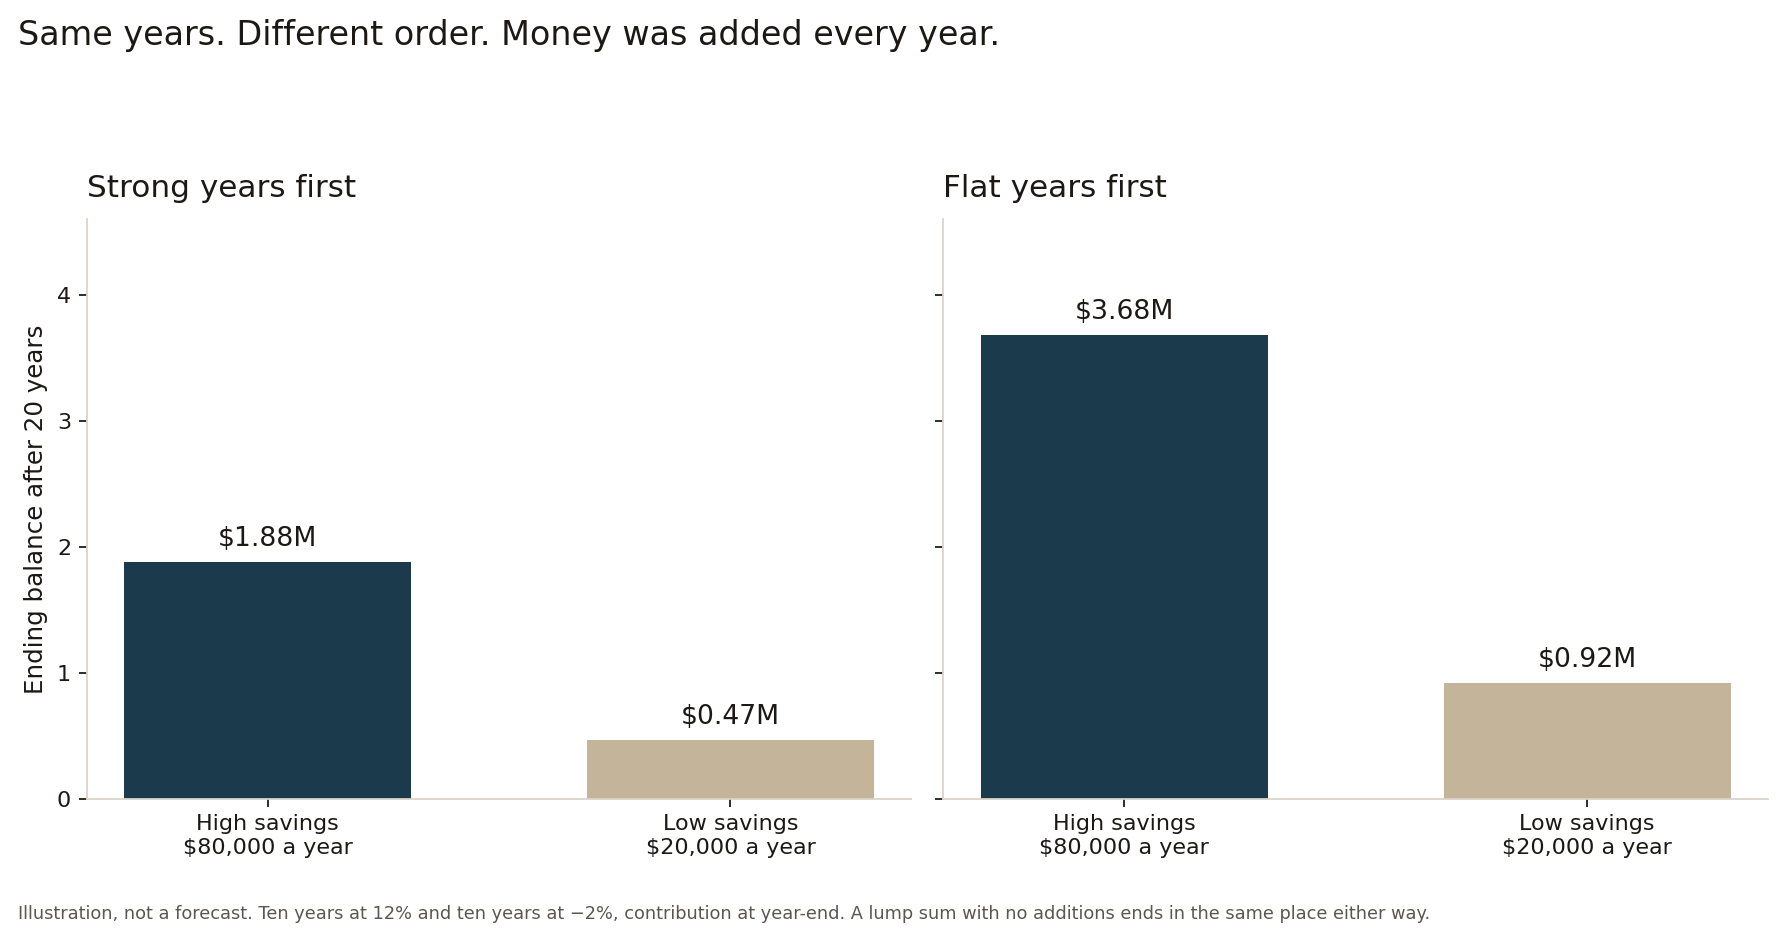
Sequence of returns risk makes the problem sharper. The order of good and bad years matters once money is moving in or out of the portfolio. A lump sum that just sits there ends in the same place either way. The order does not matter until you add money or take money out.
If the bad years hit when your balance is largest, near the end of accumulation or the start of withdrawal, you sell more shares to raise the same cash. Those shares are gone when the recovery comes. Physicians who want the option to cut back at 50 or 55 have a longer withdrawal horizon, so the sequence risk window is wider.
Savings rate beats return chasing
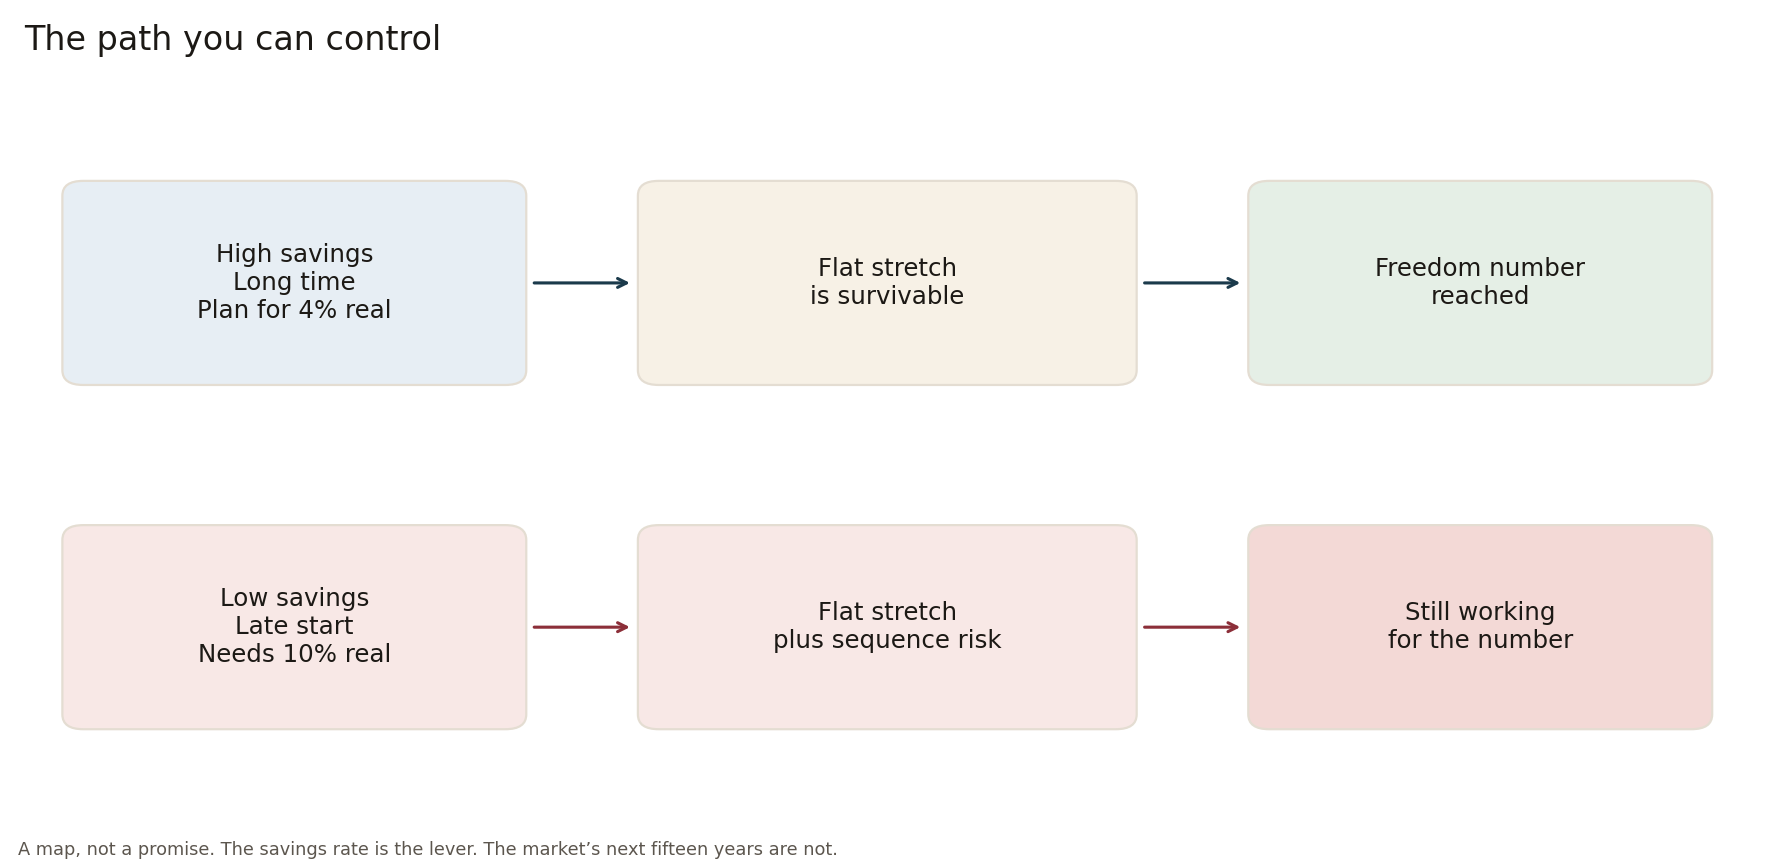
The variable you control most is the share of income you save. A high savings rate shortens the time you need strong market returns. If you need the market to return 10 percent real every year to hit your number, you are exposed to the flat periods. If you save enough that a 4 percent real return still gets you there, the flat stretches become survivable.
This is the math behind the freedom number. Annual spending times 25 is a rough starting point under the 4 percent rule. The actual number moves with your savings rate, your expected real return, and how early you start. The chart makes the case for building the plan around a conservative real return assumption rather than the historical average.
The same logic applies to side income. Extra shifts, a 1099 project, or rental income increase the savings rate without requiring the market to cooperate. Practice by Choice lays out the freedom number, the timeline, and the yearly priorities. The free Practice by Choice planner runs the same arithmetic on your numbers. The Freedom Prescription and Stethoscope to Freedom cover the same roadmap in shorter form.
What to do with the chart
Stay invested through the flat periods. Selling after a decade of nothing locks in the poor result and misses the next cluster of strong returns. Keep a cash or short-term bond buffer equal to a few years of spending once you are within five years of needing the money. Measure progress in savings rate and years of spending covered, not in whether this year's return beat the long-term average.
If you sell options for premium, the same periods matter. Cash-secured puts and covered calls can generate income in sideways markets, but the underlying shares still need to hold value over time. Defined-risk rules and position sizing matter more when the broad market is delivering near-zero real returns for fifteen years. Option Selling for Beginners and The Premium Collector are written for that environment. The free options scanner scores a cash-secured put or a covered call against those rules. It does not pick the ticker.
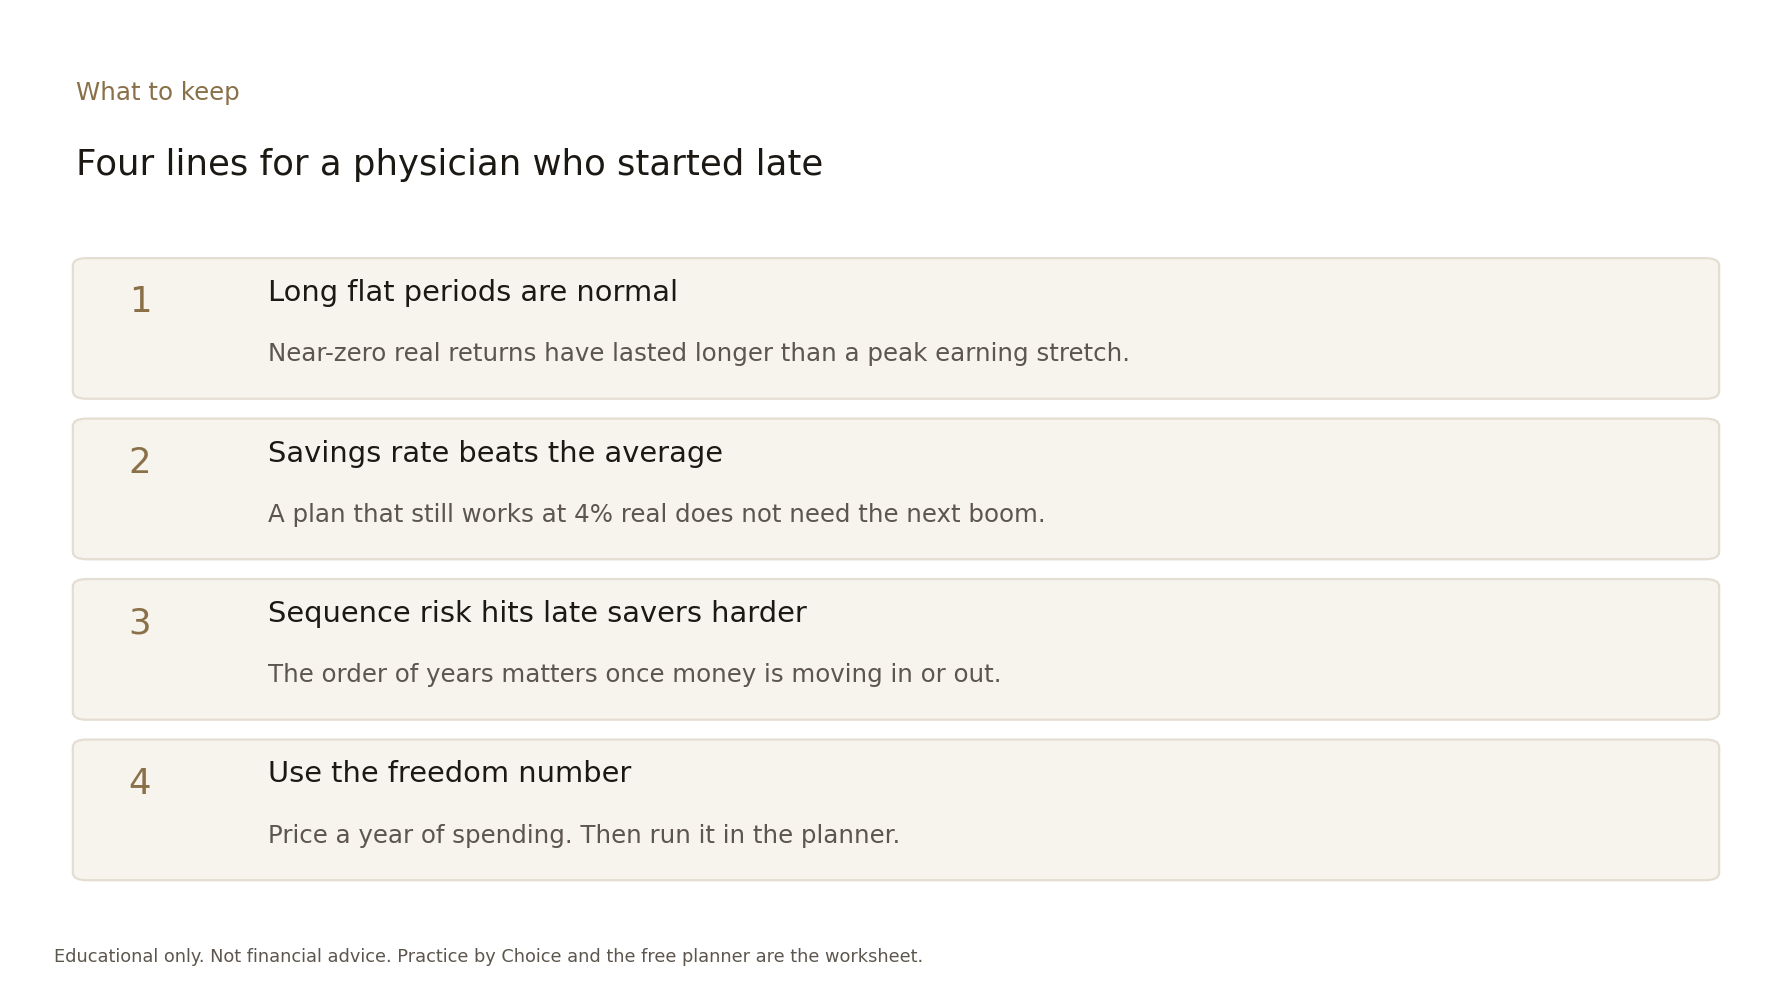
The chart is not a reason to abandon stocks. Over very long periods they have outpaced inflation. It is a reason to stop treating the long-term average as a delivery schedule. Physicians who finish training later, who carry debt into their thirties, and who want the option to work less have less time for the market to average out. The response is higher savings, a realistic return assumption, and a plan that still works if the next fifteen years look more like 1969 to 1984 than like 1985 to 1999.
Run your numbers with the planner. Read the short version in Practice by Choice or The Freedom Prescription. Then decide how much margin you actually have. The chart does not change the arithmetic. It just stops you from assuming the arithmetic will be kind.
Related
Questions or pushback? Write to hello@themargindoc.com. I read everything. I can't give individual medical or financial advice, but I answer the general version of good questions in future posts.
New posts
Subscribe by RSS, or write to hello@themargindoc.com.
Follow along
Educational only. Not financial advice. Not a recommendation to buy or sell any security. Period returns are geometric averages from Aswath Damodaran, NYU Stern, S&P 500 total return after CPI, 1928-2025. The sequence chart is an illustration with made-up yearly returns, not a forecast. Disclosures.